Loading Stories...

UX Lab Testing with Tobii PRO

Solid Edge Portal is a Cloud based software for online viewing of CAD file(s) on any device. It provides browser-based access and has functionality tāo explore models with viewing tools, section, and automatic assembly explode. User can also capture the feedback with markup.

Tobii Pro was used to validate our newly designed UI. The changes were tracked, recorded and studied to refine the product further.

Gaze Plot

User eye movement is calibrated using cameras.

The eye movement i.e. gaze is then studied. This helps to identify if he looks/searches at same position where command is provided.

Mouse Click

It is also studied, if user clicks the exact command required to complete specific task.

The results help in finalizing appropriate positioning and terminology for complex commands.

Heat Mapping

Since the eye movement is already calibrated by Tobii PRO, the software now uses heat quotient to understand where the eye actually searched for the UI, watched and waited.

Assignment Data

Huge amount of assignment data is generated which has minute details like time, area factor for each command.

Most importantly, time to complete the task is analyzed.

Usability Testing helps us to understand the usage of complex functionalities by our users during beta program and helps us refine them prior to release.
- product release team

Gaze Plot + Mouse Click Study

Each user is assigned with the task using the software.

User is given either Tobii glasses (for mobile device) or screen based tracker (for desktop).

User is asked to speak out as part of  Think-out-loud protocol.

 All the data generated is documented for study and analysis.

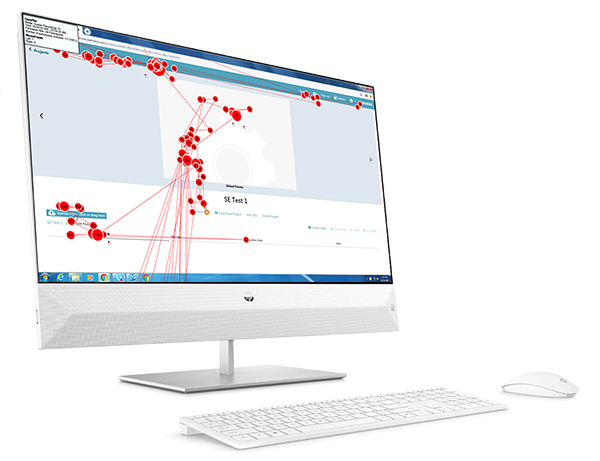
Gaze plots shows the location, order, and time spent looking at locations on the page.

User eye movement i.e. gaze is studied. It is analyzed if user searches for command at same position where it is provided.

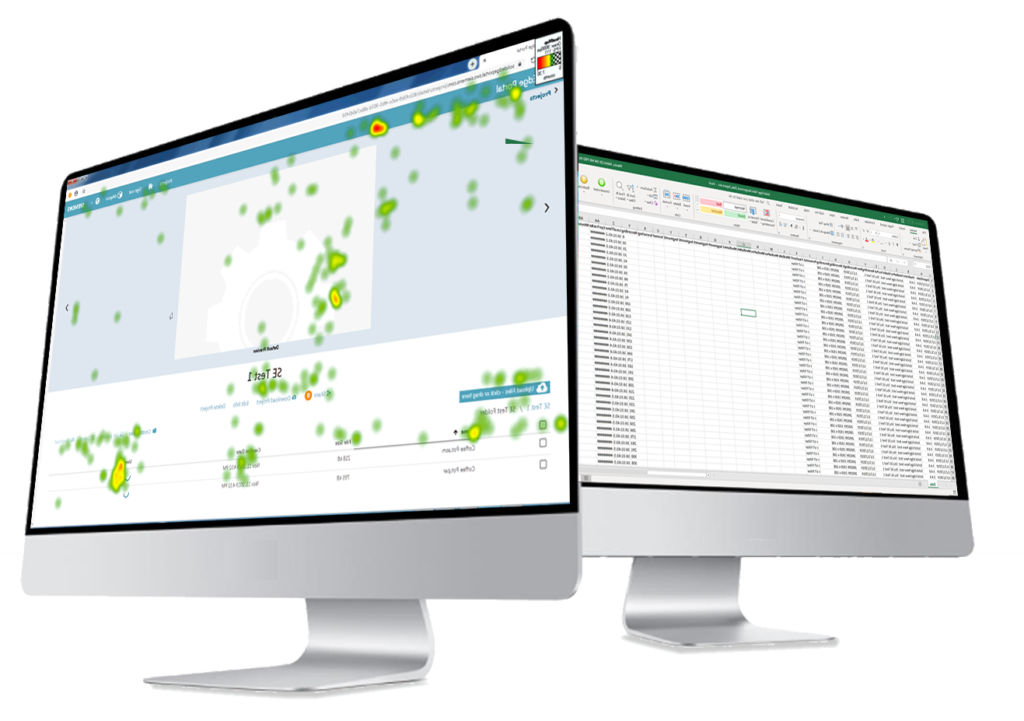
It is also studied where user gazes for maximize time to undestand priority locations.

For complex enterprise softwares, it is important to understand which command does user perceive will help him to complete assigned task.

Dropdown and RMB commands validations are done with mouse click study.

Heat Map + Assignment Data

Heat maps are a visualization that effectively revealed the focus of visual attention for given task.

Heat quotient help us to actually understand where the eye movement searched, watched and waited.

Huge amount of assignment date generated had minute details like time, are factor for each command.